
Our clients demand exceptional results from us. To fulfill their expectations, we push our boundaries. And theirs. Here are a few of our clients:
Information Experience
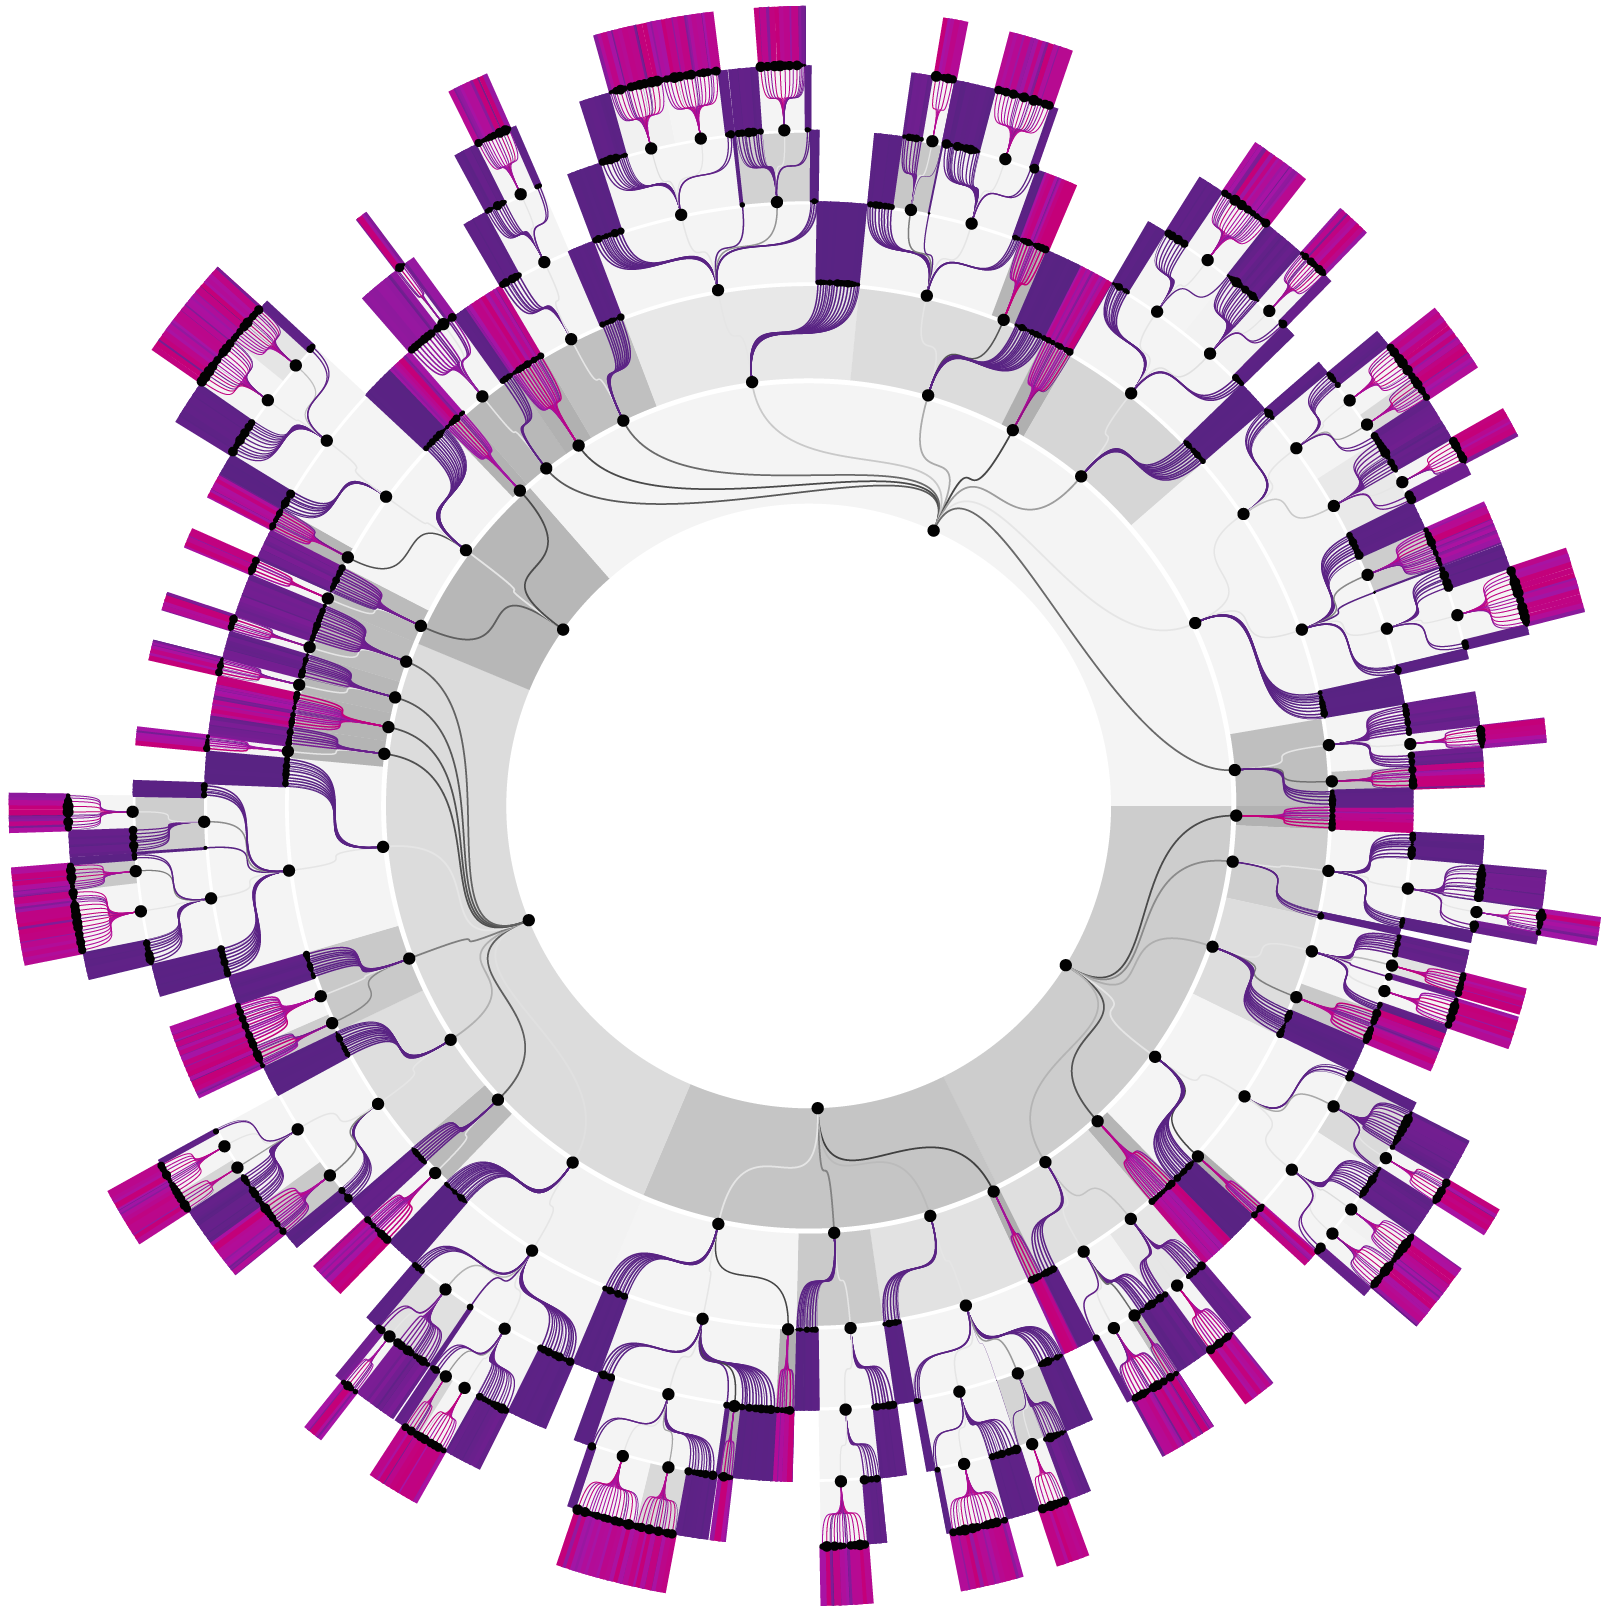
Our expertise in visual design and data analytics brings data-driven communication to the next level.
Services

Data Stories
To obtain effective and efficient information perception, we elaborate for each story the information flow with the appropriate dramaturgy. On top we combine short, concise narratives with appealing and easy to read visuals. We develop data stories for desktop, mobile devices and for print.
- Concept: information architecture, storyline
- Narratives
- Data visualizations: charts (custom and standard), graphics
- Implementation for web (desktop and mobile) or print
- Integration into existing websites
- Direct sharing on social media channels
- Cloud hosting

Data Visualizations
To captivate your audience, your information must be exceptional. Our visuals are optically pleasing and above all, they provide clarity. The design language of each graphic considers not only the context (audience, message, technology, CI) but also cognitive perception. To meet specific information needs, we develop customized components.
- Information design, wide range of visuals (charts, maps, graphics)
- Custom visuals
- Data processing for automated updates
- Direct sharing on social media channels

Interactive Solutions
Curated information platforms with automated data feed are providing valuable insights; they are gaining importance not only for companies and institutions but also for Non-profit organizations.
- Concept: information architecture, application structure, navigation and interaction
- Design and visualizations: charts, design
- Data analysis
- Data processing and integration
- Full-stack website development
- PDF reporing and data export
- Direct sharing on social media channels
- Cloud hosting
- Publishing process and CMS (content management system) integration

Information Architecture
We automate smart data analytics to discover striking data patterns and to point out hot topics which demand further action. Based on these insights and on the business context, a logical architecture is being designed serving as a solid basis for each successful application and data story.
- Business context analysis
- Big data analysis
- Automated outlier and pattern detection
- Agile information design / design thinking
- UX design (user journey, interaction patterns, communication flow )
Clients


Werks
We are performing a wide range of projects. From custom data visualizations to data-driven platforms. What they all have in common - they bring data to life. Find a small excerpt of our most recent projects below.
Data driven information platform for non-profit organization
The public, data driven website provides appealing charts and interactive maps with automated data updates. All charts can be directly exported to social media channels. The organization is able to maintain the site autonomously with WordPress.
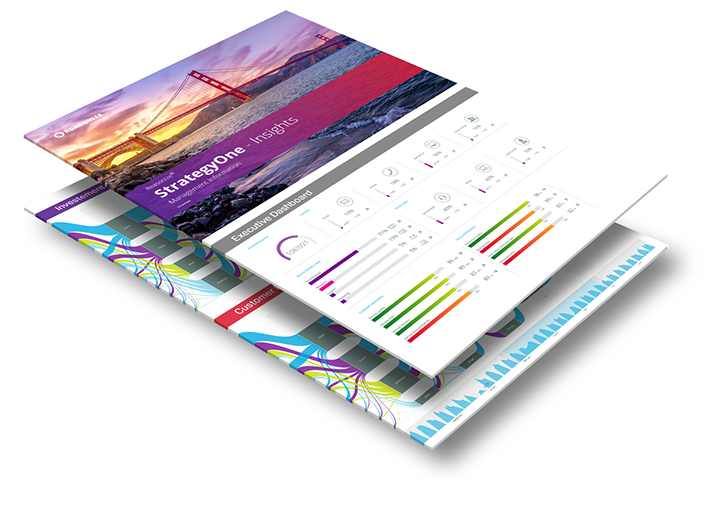
Intelligent management dashboard for insurance company
The web-based management dashboard is consolidating data from different sources. It features tailor-made interactive data visualizations and multi-dimensional slice and dice. It uses AI for an in-depth hotspot analysis to make major change drivers visible.
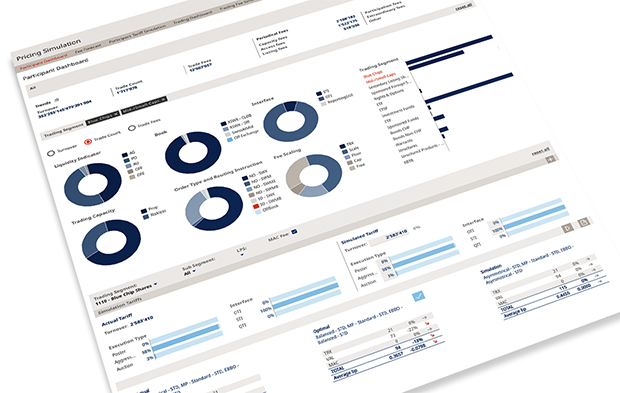
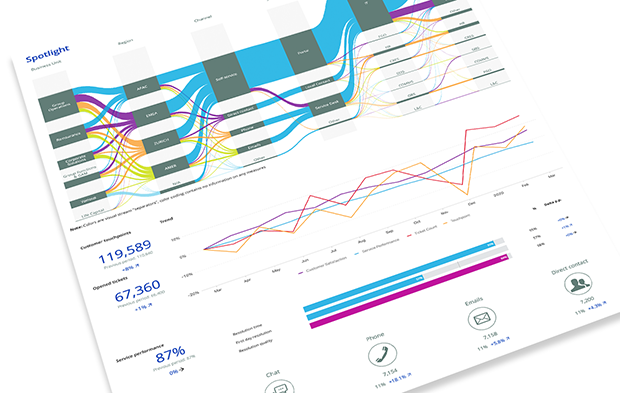
Pricing simulation tool for stock exchange
The simulation tool analyzes and visualizes the daily trading activities of all customers of the stock exchange. It allows to simulate different trading behaviors of customers and visualize the pricing impacts.
Product managers can make pricing simulations based on the real customer data and evaluate the impact of possible changes. Client reports can be generated on PDF.
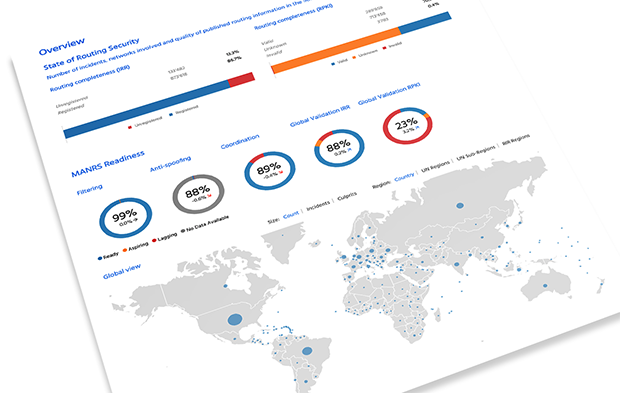
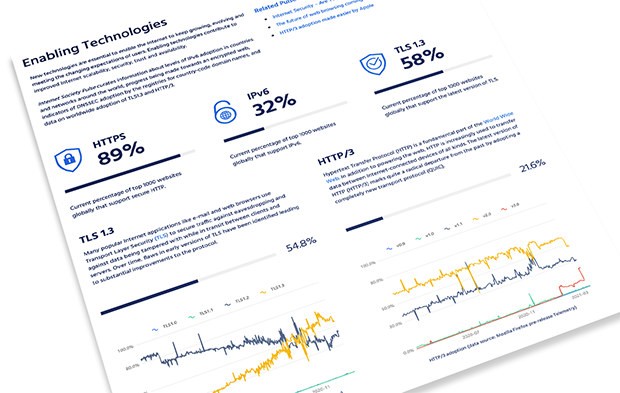
Information platform for a non-profit organization to visualize the quality of the global Internet routing system
The platform manages and aggregates an enormous amount of internet routing data. The interactive dashboard allows the public users to get insights on the current state of the global internet routing security.
Members (network providers) can access detailed information, download data and generate reports.
Pointcast.io Visual data stories in the digital age
Pointcast is the new way to get attention with data stories. The innovative user paradigm is focusing on effective cognitive information perception. It allows readers to catch complex information most efficiently. Pointcast directly links concise narratives to explanatory visuals.
The web-based stories can be easily distributed and viewed on any device. They can be deployed integrated in existing websites or directly shared on social media.
Pointcast stories can be used as teasers to get attention for knowledge reports or to distribute data driven insights from financial or management reports.
Frontwerks designs interactive data stories for desktop and mobile devices. We perform:
- Information architecture and storyline
- Narratives
- Data visualizations
- Graphic design
- Realization
- Integrated social media sharing
- Cloud hosting
Company
> Mission
Frontwerks creates clarity. We are an agency focusing on information design and technology.
It is our quest to find and communicate insights from data using the latest knowledge from neuropsychology, design and information technologies.
Our visualizations and applications provide an exceptional information experience.
> History
Finding new ways to communicate taking advantage of the latest user interface technologies has been our business since 1998. As a result of large data analytics and simulation projects, we started to automate the visualization of the results before the term ‘data visualization’ was even born. For the last 15 years, we have been developing high-end custom-made dashboards with AI and web information platforms.
Today, as information overload is omnipresent, our long-lasting expertise in communicating complex information effectively sure pays off in many different projects and in new user paradigms such as Pointcast.io.
The founders, Rainer Matthias Lang and Gabrielle Lang always strove to provide exceptional solutions together with their team of specialists. We find new ways to reach and engage different audiences.
Contact

Frontwerks AG
Tessinerplatz 7
CH-8002 Zurich
Switzerland
contact@frontwerks.com
Data Privacy Disclaimer
This website uses GDPR, CCPA and PECR compliant analytics without collecting any personal data or personally identifiable information (PII). Privacy & Terms.
Copyright © 2024 Frontwerks AG. All rights reserved.